
Quick answer
Four indicators evaluate any income property: GRM (purchase price ÷ gross revenue — quick filter), cap rate (NOI ÷ price — true yield), cash flow (NOI minus debt service — what hits your account), and DCR (NOI ÷ debt service — what the bank requires, minimum 1.1–1.25). On the North Shore in 2026, target a cap rate of 5–7% and a DCR ≥ 1.2.
ImmoMulti — direct buyer of multiplexes on the North Shore — uses four key indicators to evaluate every income property: the GRM (gross revenue multiplier), the cap rate (taux global d'actualisation), real cash flow, and the DCR (debt coverage ratio). On the North Shore in 2026, a healthy cap rate typically falls between 5% and 7% depending on the city and property condition, and a DCR of at least 1.2 is required by most lenders. A property listed at $900,000 means nothing without its numbers: two properties at the same price can have opposite yields depending on their revenues, expenses, and financing. This guide explains how to calculate each of these indicators and how to interpret them to make an informed buy or sell decision.
Why isn't price alone enough to evaluate an income property?
Two properties at identical asking prices can have opposite returns depending on rents, expenses, and financing. Without GRM, cap rate, cash flow, and DCR, list price is meaningless — run the numbers every time.
An income property is valued first and foremost by its numbers, not its appearance. Two properties at the same price can have opposite yields depending on their revenues, expenses, and financing. The four indicators below are built from two key figures:
- Gross revenue: the total of annual rents (plus parking, laundry, etc.).
- Net operating income (NOI): revenues minus expenses (taxes, insurance, utilities, maintenance, management, vacancy), before the mortgage.
What is the GRM and how do you calculate it for a multiplex?
GRM = purchase price ÷ annual gross revenue. A property at $900,000 with $90,000 gross revenue has a GRM of 10. Lower is better (typically 8–12 on the North Shore). The GRM ignores expenses — use it as a first filter only, then move to the cap rate.
The GRM (gross revenue multiplier) is the fastest filter. It compares the price to gross revenue:
A property at $900,000 generating $90,000 in gross revenue has a GRM of 10. The lower the GRM, the more quickly the property "pays for itself" through rents. It's useful for quickly ruling out an apparent bargain, but the GRM ignores expenses — which is where the cap rate comes in.
What is the cap rate and what role does it play in evaluating a multiplex?
Cap rate = NOI ÷ purchase price. It measures the income return independent of financing, and lets you compare properties directly. On the North Shore in 2026, healthy cap rates range from 5% to 7% depending on city and condition. A 6% cap rate on a $900,000 property means $54,000 NOI.

The cap rate (taux global d'actualisation) is the benchmark indicator. It relates net income to price:
An NOI of $54,000 on a $900,000 property gives a cap rate of 6%. Unlike the GRM, the cap rate accounts for expenses — making it a far more honest measure of yield. It also allows you to compare properties directly, regardless of their size.
How do you calculate the real cash flow of an income property?
Cash flow = NOI − annual debt service. If NOI is $54,000 and your mortgage costs $45,000/year, cash flow is $9,000 (+$750/month). Negative cash flow means the property requires monthly cash injections — a red flag for any income property investor.
Cash flow is the bottom line. It's what remains after the mortgage is paid:
If the NOI is $54,000 and the mortgage costs $45,000 per year, cash flow is $9,000. Positive cash flow means the property "pays for itself" and puts money in your pocket. Negative cash flow means you have to inject money every month — a red flag.
What is the DCR and why do banks require it?
DCR = NOI ÷ annual debt service. A DCR of 1.2 means $1.20 of net income for every $1 of loan payments. Most lenders require a minimum of 1.1 to 1.25 for an income property; below that, financing is refused or conditioned on a larger down payment.
The debt coverage ratio (DCR) is primarily of interest to the lender. It measures the safety margin:
A DCR of 1.2 means $1.20 of net income for every dollar of payment. Banks generally require a minimum of 1.1 to 1.25 for an income property. Below that, financing becomes difficult.
Full worked example: yield calculation for a 6-plex
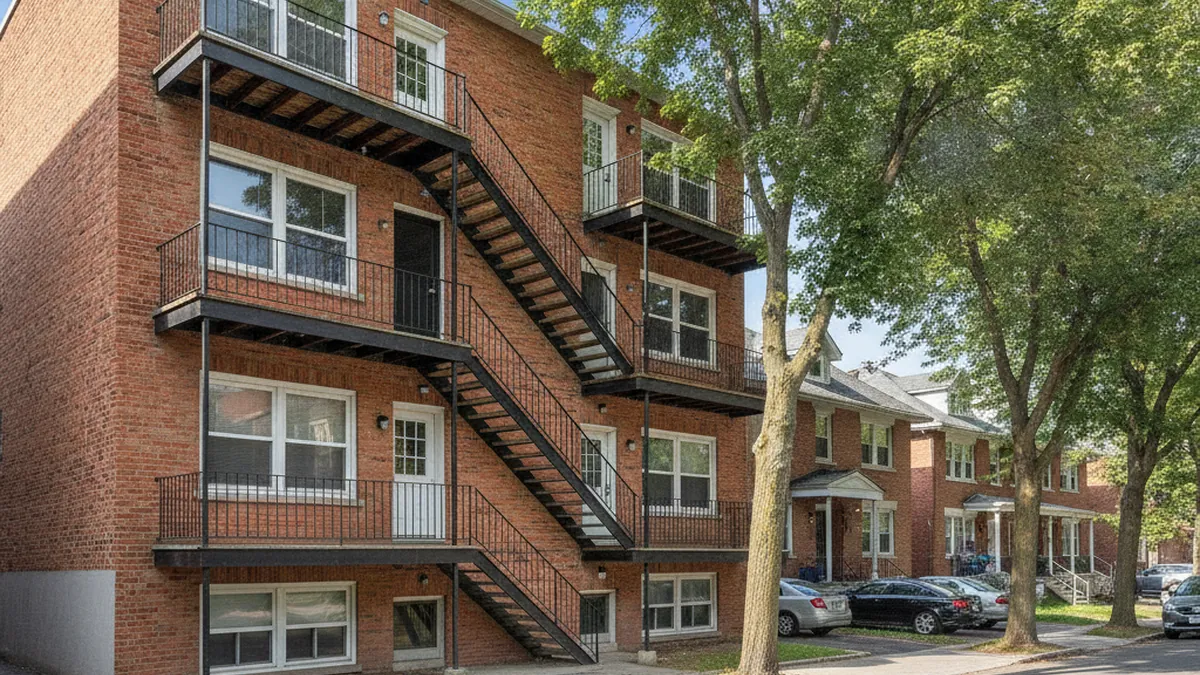
Let's put it all together for a 6-plex listed at $850,000:
| Data | Value |
|---|---|
| Annual gross revenue | $78,000 |
| Expenses (≈ 30%) | $23,400 |
| Net operating income (NOI) | $54,600 |
| Annual debt service | $45,800 |
| GRM | 850,000 ÷ 78,000 = 10.9 |
| Cap rate | 54,600 ÷ 850,000 = 6.4% |
| Cash flow | 54,600 − 45,800 = +$8,800 |
| DCR | 54,600 ÷ 45,800 = 1.19 |
Verdict: a cap rate of 6.4%, positive cash flow, and a DCR close to 1.2 make this 6-plex a reasonable purchase. Our deal analyzer calculates all four indicators at once and delivers an instant verdict.
The underestimated-expenses trap
Most "good deals" that go sideways come from undervalued expenses: overly optimistic vacancy rates, unaccounted management fees, overlooked major maintenance. Always normalize your expenses to a conservative level before calculating the NOI.
What GRM, cap rate, and DCR benchmarks should you target for a good yield?
North Shore benchmarks: GRM 8–12 (lower is better); cap rate 5–7% depending on area and condition; cash flow positive, ideally >$100/unit/month; DCR ≥ 1.2 to secure financing and maintain a safety margin. These are guides, not absolute rules — location and optimization potential matter too.
| Indicator | Prudent benchmark (North Shore) |
|---|---|
| GRM | Lower is better (typically 8 to 12) |
| Cap rate | 5% to 7% depending on the area |
| Cash flow | Positive, ideally > $100/unit/month |
| DCR | ≥ 1.2 to maintain a safety margin |
These benchmarks are not absolute rules: a well-located property with optimization potential may justify a lower cap rate. The key is to always run the numbers before making an offer. Want to sharpen your instincts? Try the Guess the Plex Price game and see whether your estimates hold up. Once you've validated the yield, also consider your financing, which directly affects cash flow and the DCR.
How do you calculate and normalize net operating income (NOI)?
NOI = normalized revenue − normalized operating expenses, before the mortgage. Add rents, parking, laundry, and storage, subtract a vacancy and bad-debt allowance (2% to 5%), then subtract taxes, insurance, utilities, maintenance, management, and janitorial. "Normalizing" means replacing the seller's optimistic figures with prudent, sustainable amounts.
All four indicators rest on a single number: net operating income. Being wrong by $5,000 on the NOI shifts the cap rate by half a percentage point and moves the property's value by tens of thousands of dollars. That's why calculating NOI deserves more attention than anything else. The golden rule: never take the seller's "pro forma" at face value. A pro forma almost always shows the property at its best — market rents rather than actual lease rents, 0% vacancy, zero management. As an owner-seller you know that reflex; as a savvy buyer, your job is to correct it.

Step 1 — Effective gross income
Start from the potential gross income (every unit rented at its current lease rate), add ancillary revenue — parking, coin laundry, storage lockers, telecom antennas — then deduct a vacancy and bad-debt allowance. Even in a tight market, budgeting 0% vacancy is a mistake: there's always a turnover gap between leases and the occasional non-paying tenant. According to the CMHC Rental Market Report, the average vacancy rate for apartments in the Montréal area rose from 1.5% in 2023 to 2.2% in 2024. For a well-kept North Shore property, a 2% to 4% allowance is prudent; for an older building or a soft rental area, use 5%.
Step 2 — Normalized operating expenses
Here are the expense lines to normalize one by one, with orders of magnitude as a starting point (always verify against actual invoices):
| Expense line | Order of magnitude (% of gross revenue) | Watch-out |
|---|---|---|
| Municipal and school taxes | 10% to 18% | Use the actual bills, not an estimate |
| Insurance | 3% to 6% | Premiums have risen sharply since 2022 |
| Utilities (common areas, heat included) | 2% to 12% | Depends on whether the owner pays heat |
| Routine maintenance and repairs | 5% to 10% | Underestimated on older buildings |
| Management | 4% to 8% | Count it even if you self-manage |
| Janitorial / snow removal / landscaping | 2% to 5% | Often omitted from pro formas |
| Capital-reserve for major work (roof, windows) | 3% to 7% | Amortize over the components' lifespan |
Added together, these expenses often represent 30% to 45% of gross revenue for a North Shore plex, more if heat is included and the building is energy-hungry. A seller quoting a 20% expense ratio is almost always showing you a property with incomplete expenses. The prudent rule: if the financials show less than 30% expenses, find what's missing before calculating the cap rate.
The management line, even when self-managing
Many buyers strike out management "because they'll manage it themselves." That's an accounting illusion: your time has value, and the day you resell, the next buyer will budget for management. Always count 4% to 6% of management in the NOI. A property that's only profitable if you work for free isn't profitable.
Which mistakes most often distort a yield calculation?
The costliest mistakes: using market rents instead of actual lease rents, ignoring vacancy, omitting management and janitorial, under-reserving for major work, confusing pre-tax and after-tax cash flow, ignoring real debt service by amortization, and comparing cap rates across different areas. Each one artificially inflates the reported yield.

After hundreds of property analyses, the same traps keep coming back. Here they are, from most frequent to most subtle:
- Confusing market rents with actual rents. A property sells on its current leases, not on what the units "could" bring. An unrealized $150/month gap per unit means an NOI overstated by thousands of dollars.
- Setting vacancy to zero. Even in a tight market, budget 2% to 5%. Zero only exists on paper.
- Forgetting management. See the callout above: budget for it systematically.
- Under-reserving for major work. A roof, windows, a French drain: these don't come up every year, but they come. Amortizing them into the NOI avoids the shock.
- Confusing cash flow with profit. Cash flow includes principal repayment, which is equity, not an expense. Zero cash flow with $15,000 of principal paid down per year is not a bad deal.
- Ignoring the loan's real amortization. The same amount borrowed costs far more per year over 20 years than over 30 — debt service changes, so the DCR and cash flow change too.
- Comparing cap rates across areas. A 5% in Rosemère and a 5% in Saint-Jérôme tell very different stories about risk and appreciation.
- Relying on "price per square foot." For an income property, revenue drives value, not gross floor area.
The common-sense test
Before validating a yield, ask a simple question: "If I sold this property tomorrow, could I defend this NOI to a skeptical buyer, invoices in hand?" If the answer is no, your figures are too optimistic. A credible NOI defends itself document by document.
Beyond the cap rate: cash-on-cash, total ROI, and return on equity
The cap rate measures the property without financing; cash-on-cash measures your money. Cash-on-cash = annual cash flow ÷ actual cash invested (down payment + acquisition costs). Total ROI adds principal repayment and appreciation. Return on equity relates total profit to accumulated equity, and explains why you sometimes need to refinance or sell.

The cap rate has a great virtue — it ignores financing, so you can compare properties directly — but also a great limit: it says nothing about the return on your money. Two investors buying the same property at a 6% cap rate earn very different personal returns depending on their down payment and rate. That's why we complement the cap rate with three measures.
Cash-on-cash return
Total cash invested includes the down payment (often 15% to 25% for a multiplex), the welcome tax, notary fees, and start-up reserves. Example: $9,000 of cash flow on $180,000 invested gives a cash-on-cash of 5%. Many North Shore investors target 4% to 6%, accepting a lower figure when appreciation or optimization potential is strong.
Total ROI (the real return)
Cash flow is only one of four ways a property makes you richer. The four yield levers of a multiplex are:
- Cash flow: the money left each year after the mortgage.
- Principal repayment: every mortgage payment reduces your balance and grows your equity — a "hidden return" paid by your tenants.
- Appreciation: the growth in the property's price over time.
- Tax advantages: notably depreciation (see below), which defers tax.
Added together, these four levers produce a total return often far above cash-on-cash alone. A property with modest cash flow but $15,000 of principal paid down and $25,000 of annual appreciation can post a double-digit total ROI.
Return on equity
As your equity grows (repayment + appreciation), the same annual profit represents a steadily smaller return on that "dormant" equity. For an owner, that's the signal it may be time to refinance to reinvest, or to sell to redeploy the capital. A property with $500,000 of equity generating only $20,000 of total profit returns 4% on that equity — sometimes less than a passive investment.
How does financing transform a multiplex's yield?
Financing doesn't change the cap rate (calculated before debt) but it drives cash flow, DCR, and cash-on-cash. Three levers matter: the down payment (15% to 25%), the interest rate, and the amortization period (25 to 30 years). Federally regulated lenders also apply a stress test: the loan must qualify at the higher of 5.25% or the contract rate plus 2%.

It's often said that "the cap rate belongs to the property, but the return belongs to the structure." Two buyers pay the same price for the same 6-plex: one puts 15% down over 25 years at a high rate, the other 25% down over 30 years at a lower rate. The cap rate is identical, but the first can be cash-flow negative while the second banks a surplus. Here's how each lever works.
The down-payment lever
A multiplex of 5 units or fewer often finances like residential; from 5 or 6 units up, you shift to commercial financing, where the lender looks first at the property's DCR. The larger your down payment, the lower the debt service, so the higher the cash flow and DCR — but the lower your cash-on-cash, because you tie up more capital. That's the central trade-off of leverage: too little down weakens cash flow, too much down dilutes the return.
Rate and amortization
The table below shows the effect of the same $700,000 loan by rate and amortization period (approximate annual payments):
| Structure | Annual debt service (approx.) | Effect on cash flow (NOI $54,600) |
|---|---|---|
| $700,000 · 4% · 25 yr | ≈ $44,200 | ≈ +$10,400 |
| $700,000 · 5% · 25 yr | ≈ $48,900 | ≈ +$5,700 |
| $700,000 · 5% · 30 yr | ≈ $44,900 | ≈ +$9,700 |
| $700,000 · 6% · 25 yr | ≈ $53,700 | ≈ +$900 |
The lesson: one point of rate or five years of amortization tips a property from comfortable to tight, without the price or cap rate changing at all. That's why you must always recalculate the yield at mortgage renewal, not just at purchase.
The lenders' stress test
Since June 1, 2021, federally regulated institutions must qualify the borrower at the higher of 5.25% or the contract rate plus 2%, a rule from the Office of the Superintendent of Financial Institutions (Bank of Canada). In practice, the bank calculates your DCR not at your real rate but at a higher "stressed" rate. A property that clears at your real rate can fail the test — prepare your numbers accordingly.
Does the cap rate vary across North Shore areas?
Yes, strongly. The most sought-after, most expensive areas (Rosemère, Blainville, Boisbriand) show lower cap rates — buyers pay a premium for stability and appreciation. More distant or income-volatile areas (Saint-Jérôme, parts of Terrebonne or Mascouche) offer higher cap rates, in exchange for greater rental risk and weaker resale liquidity.

The cap rate isn't an absolute grade: it's a thermometer of the relationship between price and income in a given area. Where buyer demand is strong and resale is fast, prices climb faster than rents, which compresses cap rates. Where the market is thinner, buyers demand a higher current yield to compensate for risk, which widens cap rates. An investor blindly comparing a 4.8% and a 6.2% without looking at the area is comparing two risk profiles, not two returns.

A crucial point for the owner-seller: the cap rate works both ways. Since price = NOI ÷ cap rate, every extra dollar of NOI capitalizes. In an area with a 5% cap rate, raising NOI by $5,000 adds $100,000 to value (5,000 ÷ 0.05). In an area at 6.5%, that same $5,000 adds only $77,000. That's why optimizing revenue in a low-cap-rate area has a magnified effect on the sale price. To place an area, rely on recent comparables and QPAREB (APCIQ) medians rather than a gut feeling.
| Area profile | Typical cap rate | What it signals |
|---|---|---|
| Prime, high-demand area (e.g. Rosemère, Blainville) | Lower (≈ 4.5%–5.5%) | Premium paid for stability and appreciation |
| Established, steady-demand area (e.g. Laval, Boisbriand) | Medium (≈ 5%–6%) | Balance of yield and safety |
| Peripheral or transitioning area | Higher (≈ 6%–7.5%) | Higher current yield, greater risk |
Case study: two properties at the same price, two opposite yields
Two 5-plexes listed at $900,000 can have inverse yields. Property A has market rents, low expenses, an NOI of $49,500 and a 5.5% cap rate. Property B has below-market rents, higher expenses, an NOI of $40,500 and a 4.5% cap rate. Same price, but A is cash-flow positive and B is negative — except B holds optimization potential that A no longer has.

Nothing shows the uselessness of price alone better than a direct comparison. Take two 5-plexes offered at $900,000 in the same area, financed identically ($700,000, 5%, 25 years, debt service ≈ $48,900/year):
| Data | Property A (well-kept) | Property B (to optimize) |
|---|---|---|
| Gross revenue | $82,000 | $75,000 |
| Normalized expenses | $32,500 (40%) | $34,500 (46%) |
| NOI | $49,500 | $40,500 |
| GRM | 900,000 ÷ 82,000 = 11.0 | 900,000 ÷ 75,000 = 12.0 |
| Cap rate | 49,500 ÷ 900,000 = 5.5% | 40,500 ÷ 900,000 = 4.5% |
| Cash flow | 49,500 − 48,900 = +$600 | 40,500 − 48,900 = −$8,400 |
| DCR | 49,500 ÷ 48,900 = 1.01 | 40,500 ÷ 48,900 = 0.83 |
At first glance, Property A is the clear winner: better cap rate, positive cash flow, higher DCR. But the analysis doesn't stop there. Property B's rents are $100 per unit below market. Bringing them gradually to market — within the rules of the Tribunal administratif du logement — could add $6,000 in revenue, lifting B's NOI to ≈ $46,500, its cap rate to 5.2% and its cash flow into positive territory. Property A, already at market, no longer has that lever. A is better today; B could become better tomorrow. A buyer who looks only at today's cap rate misses this nuance. Our deal analyzer lets you test both scenarios side by side.
How do you optimize a multiplex's yield before selling?
Since price = NOI ÷ cap rate, every dollar of NOI added capitalizes into several dollars of value. Optimization levers: bring rents to market, add ancillary revenue (parking, laundry, storage), cut expenses (utilities, insurance, management), and document clean financials. At a 5% cap rate, $5,000 more NOI is worth $100,000 of price.
This is where the yield calculation stops being a buyer's exercise and becomes a seller's tool. The income-capitalization method works in your favor: in an area with a 5% cap rate, the multiplier effect is 20 to 1 (1 ÷ 0.05). In other words, every dollar of annual NOI added is worth $20 of sale price. An owner who durably raises NOI by $8,000 doesn't gain $8,000 — they add roughly $160,000 to the property's value. Here are the levers, from most profitable to most costly.
Increase revenue
- Bring rents to market. On units that turn over, re-rent at the right price. On active leases, apply the permitted increases. For 2026, the Tribunal administratif du logement revised its rent-setting method for notices given from January 1 onward, and capital expenditures are adjusted at a fixed rate of 5% (TAL).
- Monetize the extras. Parking, storage lockers, coin laundry, seasonal storage: all ancillary revenue that lifts NOI with little investment.
- Renovate key units strategically. A refreshed kitchen or bathroom justifies a higher rent on re-rental. The rule: invest where the market pays back the return, not everywhere.
Reduce expenses
- Utilities: heating conversion, heat pumps, insulation, windows — often eligible for subsidy programs.
- Insurance: shopping the policy and bundling buildings can lower the premium.
- Management and maintenance: renegotiate snow-removal, maintenance, and janitorial contracts.
- Taxes: contest an overstated municipal assessment when justified.
The leverage of optimizing before selling
A property presented with clean financials, up-to-date leases, and a defensible NOI sells not only for more, but also faster and with less downward negotiation. Conversely, a property with fuzzy numbers invites every buyer to discount "just to be safe." Six to twelve months of preparation before listing is often the most profitable investment an owner can make.
What is the tax impact on an income property's net yield?
The reported yield is pre-tax; the real yield is measured after tax. Three elements matter: capital cost allowance (CCA), which defers tax on rental income (Class 1, 4% rate for buildings acquired after 1987); recapture of depreciation on sale, which adds the CCA claimed back into income; and the taxable capital gain. These mechanisms change the net yield you actually keep.

A property at a 6% cap rate doesn't net you 6%: tax steps in at every stage. Understanding the basics of taxation transforms how you read yield, both for the buyer and for the owner weighing a sale.
Capital cost allowance (CCA)
Net rental income is taxable, but the building (excluding land) can be depreciated. Most buildings acquired after 1987 fall under Class 1, depreciable at 4% per year on a declining balance (Revenu Québec). CCA lowers taxable income and therefore the tax owed on rental income. Note: for an individual, CCA cannot create or increase a rental loss. It defers tax; it doesn't erase it.
Recapture of depreciation on sale
The deferral has a flip side: on sale, all the CCA claimed over the years is recaptured and added back to income for the year, taxed at your marginal rate (Revenu Québec). An owner who claimed a lot of CCA can face a large tax bill in the year of sale. It's a trade-off to plan: CCA improves yield during ownership but reduces net proceeds on exit.
The capital gain
The appreciation realized on the property is a capital gain, a portion of which is taxable. Combined with recapture, it determines what actually stays in your pocket after the sale. Because these rules evolve and depend on your situation (individual or corporation), plan the exit with a tax specialist and estimate the bill in advance with our capital gains calculator.
Pre-tax yield ≠ money in your pocket
Two properties at the same cap rate can leave very different after-tax yields depending on the holding structure, accumulated depreciation, and resale horizon. Never compare a gross yield to a net one. For any precise decision, validate with an accountant or tax specialist: this guide is informational and does not replace professional advice.
Frequently asked questions
The GRM is calculated from gross revenue, without factoring in expenses. The cap rate uses net operating income — after expenses. The cap rate is more precise; the GRM serves as a quick first filter.
It varies by area and property type, but many investors target a cap rate of 5% to 7% on the North Shore. The higher the cap rate, the more net income the property generates per dollar invested — often at the cost of a less desirable location or condition.
The debt coverage ratio compares net income to debt service. A DCR of 1.2 means $1.20 of net income for every dollar of payment. Lenders generally require a minimum of 1.1 to 1.25.
No. Net operating income is calculated without debt service, in order to measure property performance independently of financing. The mortgage only enters into the cash flow and DCR calculations.
They serve to filter quickly and understand the mechanics of yield. For a purchase decision, validate the figures with actual financial statements, an inspector, and if needed, an accountant. Our tools are for informational purposes.
Add up all revenues (rents, parking, laundry), deduct a vacancy allowance, then subtract operating expenses: taxes, insurance, utilities, maintenance, management, and janitorial. The result is the NOI, before the mortgage.
Cash-on-cash compares annual cash flow to the down payment invested. Many investors target 5% or more, but the acceptable threshold depends on the area, leverage, and appreciation potential.
Management (even if you manage yourself, budget for it), vacancy, janitorial, major maintenance (roof, windows), and contingencies. Underestimating them artificially inflates the NOI and cap rate.
Yes. The same property will show a different cap rate in Laval, Terrebonne, or Montréal, because prices and demand differ. Always compare properties within the same area.
Not necessarily. A very high cap rate often comes with a riskier location or property condition. The ideal is a balance between yield, location quality, and optimization potential.
Budget 2% to 4% for a well-kept building in a sought-after area, and up to 5% for an older building or a soft rental area. The average vacancy rate for the Montréal region rose from 1.5% in 2023 to 2.2% in 2024 according to CMHC. Setting vacancy to 0% is a classic mistake that inflates the NOI.
For a North Shore plex, normalized operating expenses often represent 30% to 45% of gross revenue, more if heat is included. If financials show less than 30% expenses, find what's missing (management, vacancy, major maintenance) before trusting the reported cap rate.
Since June 1, 2021, federally regulated lenders must qualify the borrower at the higher of 5.25% or the contract rate plus 2%. The bank calculates your capacity and DCR at a "stressed" rate higher than your real rate: a property that clears at your rate can fail the test.
The cap rate doesn't change, because it's calculated before debt. But cash flow, DCR, and cash-on-cash depend directly on amortization: the same loan over 30 years costs less per year than over 25, improving cash flow at the cost of slower principal repayment.
Because value capitalizes: price = NOI ÷ cap rate. In an area with a 5% cap rate, every extra dollar of annual NOI is worth $20 of sale price. Durably raising NOI by $8,000 therefore adds roughly $160,000 to the property's value, not $8,000.
CCA (Class 1, 4% per year for buildings acquired after 1987) reduces tax on rental income during ownership, improving after-tax yield. But on sale, the CCA claimed is recaptured and added back to taxable income. It defers tax; it doesn't erase it. Validate with a tax specialist.
Yes. At $900,000, a property with $49,500 NOI shows a 5.5% cap rate and positive cash flow; another with $40,500 NOI shows 4.5% and negative cash flow. Same price, inverse yields. Revenue, expenses, and financing determine the quality of the purchase, not price alone.
Not necessarily. Cash flow is only one of four yield levers, alongside principal repayment, appreciation, and tax advantages. A property with zero cash flow but $15,000 of principal paid down and good appreciation can post a high total return. Measure all four levers, not just cash flow.


Have a property in mind? Let's run the numbers together.
Receive a written purchase offer within 48 hours. No brokerage fees, no obligation, complete confidentiality.
Get a purchase price →