In 2026, ImmoMulti — a direct buyer of multi-unit properties on the North Shore — observes a price per door hovering between CA$195,000 and CA$285,000 depending on the city and condition of the property, while cap rates range between 5.0% and 6.2%. After two years marked by rapid interest rate increases and buyer caution, the income property market on Montreal's north crown is showing clear signs of stabilization. The Bank of Canada is holding its policy rate around 2.25%, 5-year fixed rates are around 3.7%, and rental fundamentals remain solid: the vacancy rate in Laval was around 3.4% according to CMHC, and several North Shore cities show rates below 2%. Prices have settled without collapsing and gaps between cities are widening. This article reviews the situation, city by city, on price per door, observed cap rates and underlying trends — with honest benchmarks rather than figures presented as certainties.
2026 Market Overview: Where Do North Shore Multi-Unit Properties Stand?
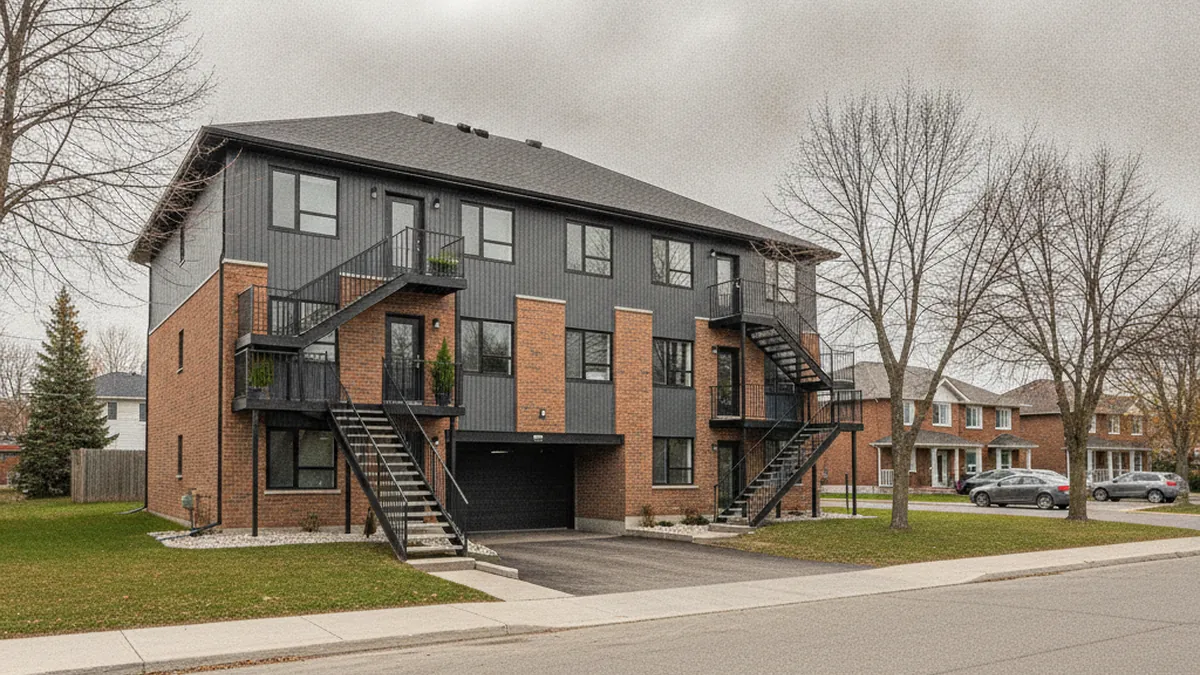
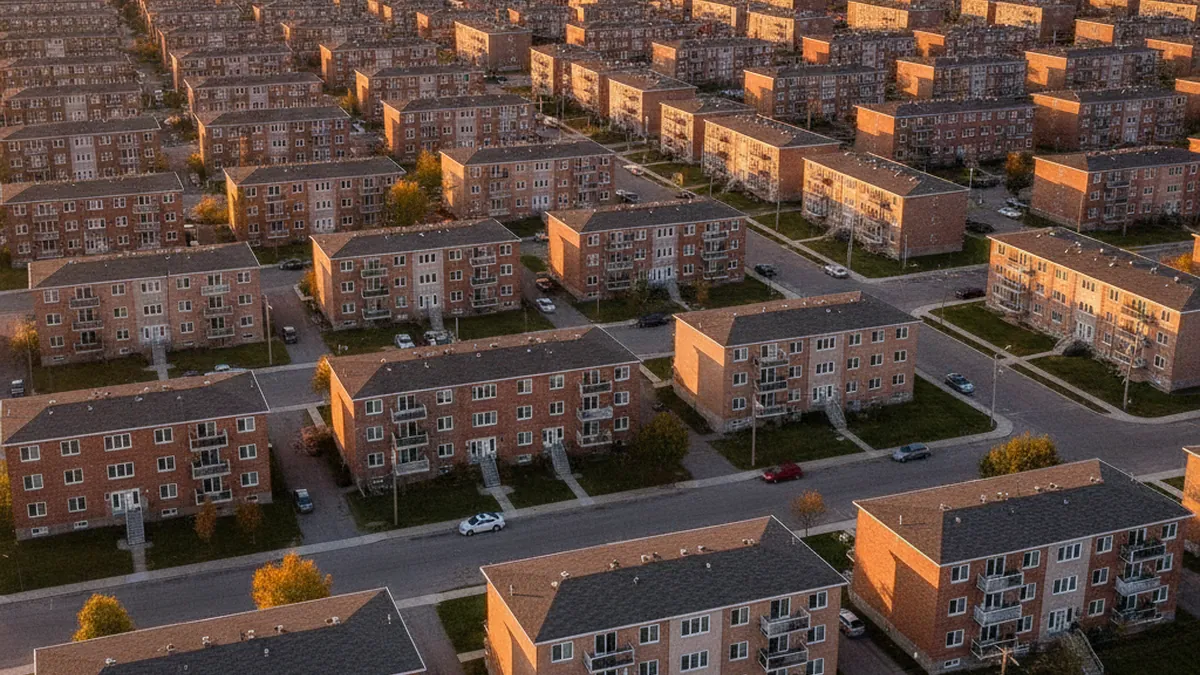
The North Shore — encompassing Laval, Terrebonne, Repentigny, Mascouche, Blainville, Boisbriand, Saint-Jérôme, Sainte-Thérèse, Mirabel and their neighbours — remains one of the most active multi-unit markets in Greater Montreal. The reason is structural: sustained demographic growth, households leaving the island in search of space, and rental supply struggling to keep pace with demand.
In 2026, the financing context has changed completely from the 2023 trough. The Bank of Canada has brought its policy rate down to around 2.25% and has held it there for several consecutive meetings. 5-year fixed mortgage rates are around 3.7% and variable rates around 2.7%, depending on the borrower profile and lender. For the multi-unit investor, this means a much more predictable cost of capital than in 2023-2024 — which is gradually bringing buyers back to market.
On the rental fundamentals side, conditions remain tight. In Laval, CMHC's survey reported a vacancy rate around 3.4% and an average rent close to CA$1,350 with double-digit annual increases in some segments. Several smaller North Shore cities show even tighter vacancy rates, often below 2% depending on the area. This scarcity supports rents and, by extension, property values.
What Is the Price per Door for a Multi-Unit Property on the North Shore in 2026?
The "price per door" (sale price divided by the number of units) remains the reference indicator for quickly comparing two properties. On the North Shore in 2026, it sits, generally speaking, in a range of approximately CA$195,000 to CA$285,000 per door — but this range conceals considerable variation depending on the city, year of construction, building size and quality of location.
A few important nuances to keep in mind:
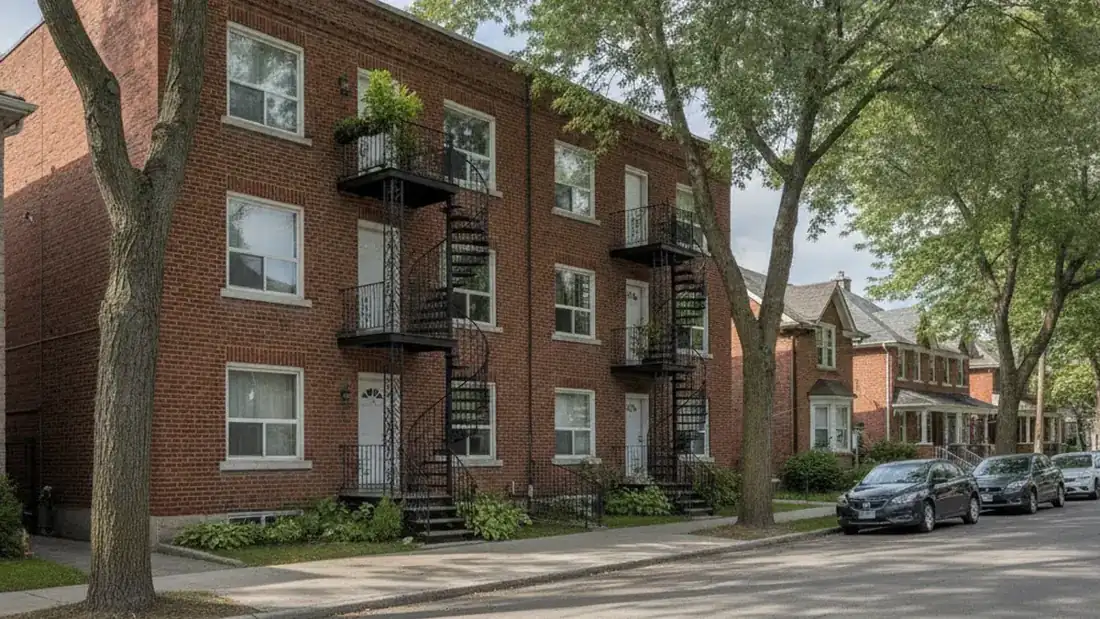
- The type of property matters more than the average. A small, well-located plex (duplex, triplex) in Laval or Sainte-Thérèse can well exceed the top of the range, because these properties also attract owner-occupants, not just investors.
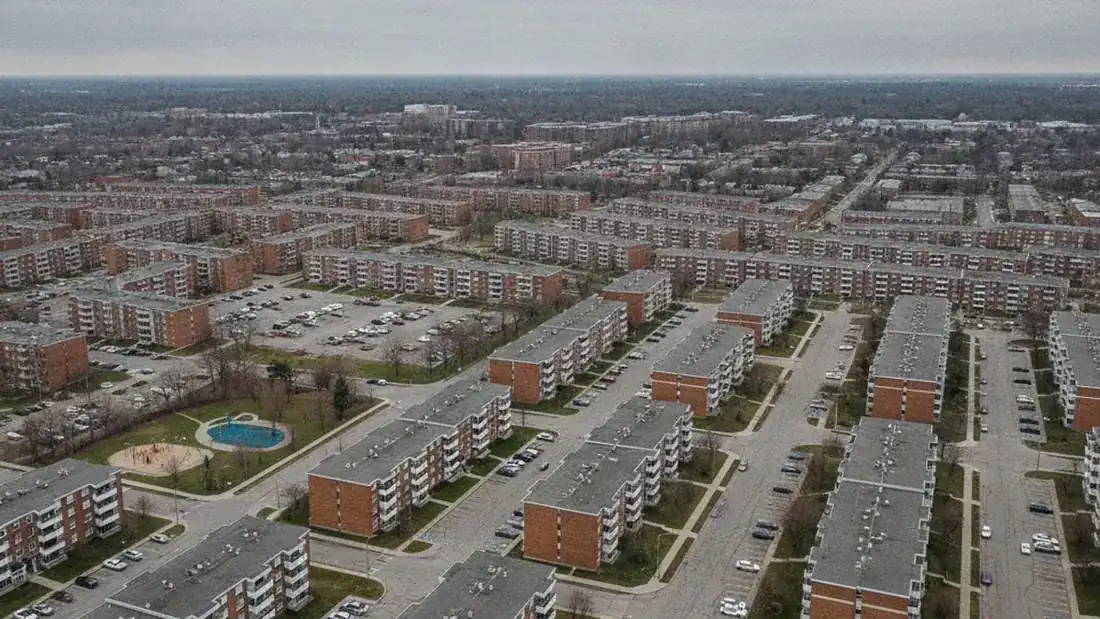
- Large buildings (12 units and more) often transact at a lower price per door than small ones, but with often more predictable yield and more efficient per-unit management.
- Year of construction and building condition shift value considerably: roofing, windows, plumbing, electrical and heating systems represent major expenses that an informed buyer will discount into their price.
Price per door is useful for a first pass, but it does not replace a yield analysis. To quickly validate whether an asking price holds up, you can use our offer calculator, which starts from real income and expenses rather than a regional average.
What Are the Cap Rates on the North Shore in 2026?

The cap rate (capitalization rate) is the ratio between net operating income (NOI) and the property price. The higher the cap rate, the more the property "returns" per dollar invested — but a high cap rate also generally signals a riskier or less prime location.
In 2026, observed cap rates on the North Shore sit roughly between 5.0% and 6.2%, depending on the city and nature of the asset. This is a slight decompression from the 2021-2022 lows, when cheap money pushed cap rates below 4.5% in the most sought-after areas. This moderate rise is logical: when financing costs rise, buyers demand higher yields to compensate.
Concretely:
- Prime and stable markets (Laval, Blainville, Sainte-Thérèse, Boisbriand) tend toward the low end of the range — around 5.0% to 5.5% — because demand is strong and perceived risk is lower.
- Growth or more peripheral markets (Saint-Jérôme, Mirabel, Mascouche) often offer more generous cap rates, around 5.5% to 6.2%, which can suit an investor seeking current yield.
Cap rate is not a ranking of "good" and "bad" cities
A lower cap rate does not mean "bad buy": it often reflects a safer, more liquid asset that will better hold its value. Conversely, a high cap rate can hide upcoming work or more volatile vacancy. The right cap rate depends on your strategy. To calculate it for a specific property, use our cap rate calculator.
City-by-City Trends: North Shore Multi-Unit Market
Here is a qualitative, city-by-city reading. Exact figures vary from one transaction to the next; consider the following as underlying trends rather than official benchmarks. For a quick geographic view, see the North Shore plex price map.
Laval
The core of the North Shore market, Laval combines market depth, public transit (metro, future network extension) and robust rental demand. Price per door is among the highest in the region and cap rates among the tightest. It is a quality, liquid market — but you pay for the security.
Terrebonne and Mascouche
The Terrebonne-Mascouche area benefits from strong household growth and ongoing residential development. Terrebonne offers a good balance of price, rental demand and quality of life; Mascouche, more in a growth phase, can offer cap rates a notch more generous.
Repentigny
An established family market to the east, Repentigny attracts stable rental demand. Its supply of mid-size buildings is appreciated by investors looking for a quiet asset, with price per door generally more affordable than Laval.
Blainville, Boisbriand and Sainte-Thérèse
This trio on the western crown is seen as stable and sought-after. Returns are tighter (low cap rates), but risk is low and resale is generally easy. Ideal for an investor prioritizing capital preservation.
Saint-Jérôme and Mirabel
Further north, Saint-Jérôme and Mirabel stand out for marked growth and often higher cap rates. These are markets where better current yield is achievable, in exchange for somewhat greater volatility and sometimes lower liquidity.
Comparative Table: Price per Door and Cap Rate by City
The table below synthesizes 2026 trends. The ranges are indicative orders of magnitude, to be validated case by case — they do not constitute an official appraisal.
| City | Price per door (order of magnitude) | Indicative cap rate | Market profile |
|---|---|---|---|
| Laval | CA$225,000–CA$285,000 | 5.0%–5.5% | Prime, liquid, strong demand |
| Blainville | CA$215,000–CA$270,000 | 5.0%–5.6% | Stable, low risk |
| Boisbriand | CA$210,000–CA$265,000 | 5.1%–5.7% | Stable, sought-after |
| Sainte-Thérèse | CA$210,000–CA$265,000 | 5.1%–5.7% | Stable, sustained demand |
| Terrebonne | CA$205,000–CA$260,000 | 5.3%–5.9% | Balanced, growing |
| Mascouche | CA$200,000–CA$255,000 | 5.4%–6.0% | Growth, yield-oriented |
| Repentigny | CA$200,000–CA$250,000 | 5.4%–6.0% | Family-oriented, stable |
| Saint-Jérôme | CA$195,000–CA$245,000 | 5.6%–6.2% | Strong growth, yield-oriented |
| Mirabel | CA$195,000–CA$245,000 | 5.6%–6.2% | Strong growth |
To translate these benchmarks into a concrete analysis for a real property — income, expenses, financing, down payment — use our deal analyzer.
What Factors Are Driving the North Shore Multi-Unit Market?
Several forces explain where prices and cap rates stand in 2026, and where they could go:
- Financing cost. With a policy rate around 2.25% and 5-year fixed rates around 3.7%, carrying cost has stabilized. As long as the Bank of Canada holds course, cap rates should remain relatively stable rather than continuing to rise.
- Rental scarcity. Tight vacancy rates and rising rents support net income, and therefore property values. This is the main barrier against a price decline.
- Insured financing programs. CMHC programs of the CMHC MLI Select type remain widely used in 2026. In exchange for affordability, energy efficiency and accessibility commitments, they offer rates often 0.5% to 1.5% below conventional, longer amortization and a high loan-to-value ratio — which improves the return on equity.
- Demographics. The movement of households to the North Shore, immigration and population aging sustain underlying rental demand.
- Construction cost. Building new is expensive; this supports the value of existing buildings and limits new supply in the short term.
For investors targeting discreet, off-market acquisitions, direct private transactions remain a preferred channel in 2026 — see our off-market deals.
Is It Better to Sell or Buy a Multi-Unit Property on the North Shore in 2026?
For an owner-seller, 2026 is more favourable than 2023-2024: buyers are back, financing is predictable and rental scarcity is supporting values. The challenge is setting a realistic price — not anchored to 2021 peaks, not underpriced out of caution. A well-maintained property with up-to-date leases and documented income sells well and quickly.
For an investor-buyer, the market rewards rigour. The days when "everything was going up" are behind us: returns are earned through serious analysis of income, expenses, upcoming work and financing structure. That is precisely where a calculation of the gross rent multiplier (GRM) helps to quickly compare several opportunities before going further.
Thinking of selling your multi-unit on the North Shore?
At ImmoMulti, we buy income properties directly on the North Shore, without brokerage commission and in complete confidentiality. We can deliver an offer in 48 hours based on your figures. Receive an offer online.
How to Interpret These Market Figures Responsibly
The price and cap rate ranges presented here are orders of magnitude drawn from market trends and public data (notably from CMHC and the Bank of Canada). They do not constitute an appraisal or a guarantee of value for any specific property. Two neighbouring properties can transact under very different conditions depending on their condition, leases, financing and timing.
A few principles for properly interpreting these benchmarks:
- Always start from the property's real income and expenses, not a regional average.
- Distinguish current income from potential income (below-market rents, units to renovate, spaces to optimize).
- Factor in upcoming work and transaction costs into the yield calculation.
- Validate everything with professionals (accountant, appraiser, mortgage broker) before making a move.
Important Notice
This article is provided for informational purposes only and does not constitute financial, tax or legal advice, nor a real estate appraisal. The figures are estimates subject to change. Consult qualified professionals before any purchase or sale decision.